










Hands stacking coins to illustrate saving, budgeting, or building financial growth

Mortgage Rate Intelligence & Market Updates

Stay informed about economic developments that may influence mortgage rates and home financing decisions. Explore updates covering inflation, Federal Reserve policy, Treasury yields, housing trends, and other important market indicators. Use the category filters to browse relevant economic and mortgage news, then select an article to read the full update. Review the latest stories and market insights to better understand changing conditions when considering your mortgage options.
RATE WATCH
FED FUNDS RATE 3.88%
NEXT FOMC 10/28/2026
NEXT MOVE 28.4% HIKE
IMPLIED CHANGE +7.1 bps
12-MONTH OUTLOOK +81.7 bps 3 or 4 hikes
TARGET BAND 3.75 - 4.00%
SOFR 3.87%
LATEST FED UPDATE 10/5/2026

What Today’s Economic Data Can Mean for Mortgage Rates

Mortgage rates can respond to changes in inflation, employment, Federal Reserve policy, Treasury yields, and expectations about future economic growth. These factors do not determine mortgage rates by themselves, but they can influence the broader bond market and the pricing lenders offer.

For homebuyers and homeowners, the important question is not simply whether economic news is “good” or “bad.” The key is how new information changes expectations for inflation, interest rates, and the economy. Those changes can contribute to mortgage rate movement and affect purchasing power, refinance opportunities, and monthly payment estimates.

Use the market updates below as supporting information, then consider your specific loan type, credit profile, property, and financing goals when evaluating current mortgage options.

Economic News Hub

Real Estate & Financial Market Updates

Article
Home surrounded by housing market chart, property photos, and house keys on a burgundy background

Pending home sales are falling, but the slowdown isn’t hitting every market

Falling pending sales are revealing a more uneven housing market
Stylized U.S. map with flowing market trends, housing icons, and weather patterns across regions

A Super El Niño is brewing — what it could mean for housing

California and the Gulf Coast are projected to be the main, but not only, impact areas
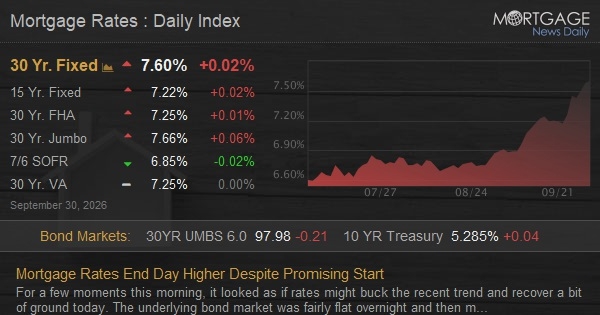
Mortgage Rates End Day Higher Despite Promising Start

Mortgage Rates End Day Higher Despite Promising Start

For a few moments this morning, it looked as if rates might buck the recent trend and recover a bit of ground today. The underlying bond market was fairly flat…
Credit score graphic showing a credit rating gauge with home, payment, education, and financial icons

CHLA backs Pulte plan for GSE credit score disclosures

Letter to FHFA says the added data could improve MBS transparency and reduce recurring credit score cost increases
Compass International Holdings graphic with a business professional on a video display and MLS server racks

Compass’s Reffkin gives MLSs an ultimatum: Change listing rules or face lawsuits

Exclusive HousingWire coverage from CMLS: Reffkin said Compass could file antitrust suits by mid-October and set an October 6 deadline
House with architectural plans, legal document, and pen on a burgundy background

Archwest Capital closes $300M rated RTL securitization

Deal is backed by 218 loans, plus a $98.5M accumulation account and a two-year revolving structure
House with technology circuit, AI assistant, and keys representing smart home financing solutions

Zillow’s Samuelson: Undermining the MLS could bring regulators knocking

Exclusive coverage from CMLS: Samuelson cited Hill scrutiny of Compass and MRED and warned data restrictions could invite regulation
Texas mortgage professionals with Texas map, home equity icon, and light bulb graphic

Texas Mortgage Source: Reverse is the ‘largest underserved market in the business right now’

At AIME Fuse in Austin, Mark Hairston and Shara Parker shared successful borrower scenarios for unlocking nearly $15 trillion in U.S. senior home equity
Rodney Rose Mortgage Team
Loans available nationwide
Low Rate, Low Fee.
"A Loan for every home"
Guaranteed Closing*
Rodney Rose, Loan Officer and Branch Manager
Rodney Rose
Loan Officer / Branch Manager
NMLS#: 1396861 DRE#: 00853403
C: (916) 232 3040
E: rrose@emortgagecapital.com
W: MortgageMarketUpdate.com
Better Business Bureau accreditation badge on a white background
Offices
Rising home prices shown as houses atop ascending columns

Home Prices Keep Climbing, Just Not Everywhere

Home prices picked up a little more speed in July, as both FHFA and the S&P Cotality Case-Shiller Home Price Indices showed stronger annual appreciation than in their previous readings. The gains remain relatively modest by historical standards, and while nominal prices are still moving higher nationally, the picture looks considerably less impressive after accounting for inflation. The FHFA House Price Index rose 0.3% from June to July, bringing the annual increase to 2.6% . While the national market is still technically appreciating, there’s more and more variation between different metro areas with some holding steady or even contracting. Case-Shiller tells a similar story, though its national measure is running at a somewhat slower pace. The U.S. National Home Price Index rose 1.9% year over year in July, up from 1.6% in June. The 10-City Composite increased 3.4% , while the 20-City Composite was up 2.5% . The annual price appreciation chart shows a nice little uptick, but the takeaway is tempered in inflation-adjusted terms. Both of the big U.S. inflation reports showed annual changes of 3.4% last month, and even higher in July (the month that lines up with these home price reports). Any way you slice it, that means home prices aren’t keeping pace with broader inflation. Whether or not that’s a bad thing is another story. Some would say it wouldn’t be the end of the world for prices to merely hold steady and allow income growth to slowly chip away at affordability. 

Read More »
Mortgage rates end higher after an early dip, with 30-year fixed at 7.57%

Mortgage Rates End Higher Despite Promising Start

Mortgage rates rose 0.04% today to an index value of 7.57% for a top-tier 30yr fixed scenario for the average lender today. That uptick in and of itself isn’t especially large, but it’s a bit counterintuitive on a day where the hotly anticipated jobs report came in much weaker than expected.  The jobs report has 2 key components: Nonfarm Payrolls (NFP) and the unemployment rate. For most of the time any rate watcher can remember, NFP matters way more. The market still reacts to it (which is why bonds initially improved this morning), but unemployment has arguably taken the lead in terms of accurately capturing labor market trends. Even then, today’s unemployment rate of 4.2% (up from 4.1% last month) shouldn’t have been a problem. The catch was that the unrounded numbers made the gap even smaller (4.175% vs 4.141%). Additionally, more people entered the labor force. If the labor force had held steady with last month, today’s unemployment rate would have been 3.951%. None of those numbers is particularly troubling for the employment outlook, but 3.951% especially so. That helped explain why bonds eventually gave back their early gains, along with a rebound in oil prices and easing concerns about European bond markets that had helped U.S. rates move lower yesterday. When bond gains evaporate, mortgage lenders may be forced to raise rates during the day. This happened on multiple occasions. The average lender was actually slightly lower at first, but ultimately ended higher compared to Thursday’s latest levels. 

Read More »
By using our site, you agree to use our cookies. For more information, read our Privacy Policy