










August CPI shows sticky core inflation ahead of Fed meeting
Economists pointed to persistent services inflation as a factor that could keep borrowing costs elevated

Economists pointed to persistent services inflation as a factor that could keep borrowing costs elevated

MLS architecture needs to become ready for a world in which machines increasingly interact with housing data
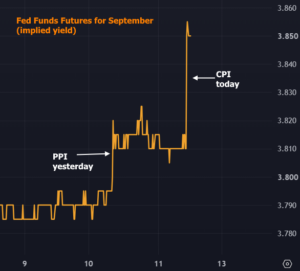
We’ve been saying for a while that the longer end of the bond market really wants to see the Fed get serious about fighting inflation. This is why yields spiked on July 29th when the Fed held rates steady and Warsh said he’d let the bond market do the heavy lifting. Now today, we have back-to-back inflation reports that resulted in Fed Funds Futures pricing in a 90% chance of a hike at next week’s meeting. Fed Funds Futures are the only thing that’s unequivocally selling off this morning. 2yr Treasuries (heavily impacted by Fed expectations) are mixed, but the longer end of the curve is now rallying thanks to the expectation of the rate hike and the hope that it pushes back against inflation.
it also doesn’t hurt that oil prices turned a corner overnight.


Housing costs remain out of reach, and people are hungering for affordable options. Learn about the cheapest states to live and buy a house. The Midwest and South topped the list.
The post The 10 Most Affordable States in the U.S. in 2026 appeared first on Redfin | Real Estate Tips for Home Buying, Selling & More.

Ugly Snowball Selling Thanks to Oil and Inflation Data
MBS lost nearly a full point by 4pm ET and 10yr yields were up 11.4bps at 4.95%. This is the highest since October 2023 when 10s briefly hit 5.006%. At one point in the overnight session, yields were slightly LOWER on the day. Things changed in waves. First wave: oil prices surged overnight and had already broken $100 but the time PPI came out. Second wave: PPI was roughly in line with forecasts, but internal components suggested a 0.1 increase to core PCE inflation. The reaction was the sharpest of the day for bonds. Third wave: late day illiquid redistribution after 30yr bond auction (although this could also be incidental drift ahead of Friday’s CPI data). If we could only focus on 2 things, it would be the acceleration in the fuel price trend and the unfriendly PCE implications in today’s PPI data.
Econ Data / Events
Core PPI m/m (Aug)
0.2% vs 0.3% f’cast, 0.2% prev
Core PPI y/y (Aug)
4.6% vs 4.6% f’cast, 4.2% prev
Jobless Claims (Sep)/05
206K vs 205K f’cast, 206K prev
PPI m/m (Aug)
0.4% vs 0.4% f’cast, 0% prev
PPI y/y (Aug)
5.4% vs 5.3% f’cast, 4.7% prev
Market Movement Recap
09:39 AM Much weaker on a combo of oil and PPI reaction. MBS down 5/8ths and 10yr up 8bps at 4.92
01:09 PM MBS down 22 ticks (.69) and 10yr up 8bps at 4.92
03:39 PM MBS down just over 7/8ths of a point and 10yr up 11.6bps at 4.957
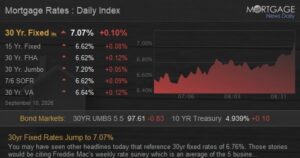
You may have seen other headlines today that reference 30yr fixed rates of 6.76%. Those stories would be citing Freddie Mac’s weekly rate survey which is an average of the 5 business days (4 in this case, due to the holiday) ending yesterday (September 9th). Because of that methodology, the number lags reality. Today alone, the average lender moved up 0.125% in rate. In addition, Freddie no longer accounts for “points” (additional money paid upfront for a lower rate). In other words, 6.75% with one point is roughly the same rate as 7.00% with no points. As a reminder, our daily rate index accounts for the impact of points so day to day comparisons are always apples to apples. With all that in mind, today’s average top-tier 30yr fixed rate is up to 7.07% from 6.97% yesterday and 6.89% the day before. This is a substantial 2-day change and the highest rate we’ve seen since May 21, 2025. While some people are erroneously talking about last night’s news regarding $5k payments from the President, there are only two real factors that account for a vast majority of the upward movement. The first was yet another surge in fuel prices. The second was a poorly received Producer Price Index this morning (an inflation report that contributes to the even more important PCE inflation data due out at the end of the month). [thirtyyearmortgagerates]

Here in San Antonio, TX, interest rates are obviously part of mortgage event discussion. (On today’s The Big Picture Guild’s David Battany will be discussing rates and recent developments impacting them with Robbie C. and me.) Here’s what happens when you mix campaign promises, mortgage rates and the markets. Texas is a border state, obviously impacted by changes in immigration policy, especially when it comes to employment. Last Friday’s employment data showed strong job growth, but overall, a muddled picture. For example, the hiring rate is very low, and hiring is concentrated in restaurants, bars, and health care. The “worry” driving rates is on the inflation side. The U.S. Federal Reserve is likely on hold for the September meeting, given current data, and on hold in October given the meeting is a few days before the mid-term election. Our Mortgage Bankers Association recently moved its mortgage rate prediction higher and brought down 2026 volume and unit predictions and estimates that 2027 is expected to be close to this year’s production. Meanwhile, lenders are acting. Ryan Grant with NEO Home Loans, for example, wrote to say that the company created an assessment for mortgage professionals to take that helps them better understand the opportunity to take a new path in origination. “To date, we have had 500+ mortgage professionals take this assessment. Here is the quick 10-minute YouTube video that explains what we have created and why it’s so important.” (Today’s podcast can be found here. This week’s ‘casts are sponsored by NFTYDoor, the MLO’s favorite HELOC platform. A broad buy box and hands-on mortgage expertise mean more loans close, faster, for banks, credit unions, and brokers. Clean files close in as little as zero days.
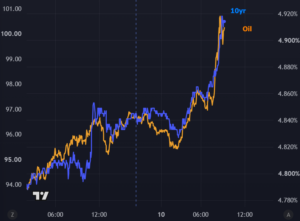
It’s been a rough couple of days for the bond market. Yesterday, it was Bessent and the reaction to the Treasury buyback announcement. Today it is an overnight surge in oil prices and a lackluster reaction to the Producer Price Index (PPI). PPI doesn’t tend to move markets as much as CPI (due out tomorrow), but it certainly can for two reasons: on the rare occasions when it is released before CPI and when its components suggest an increase in PCE inflation. In other words, parts of the PPI data have a bearing on PCE and PCE is ultimately what matters most. The market doesn’t always trade it that way because PPI/CPI reveal so much about PCE that PCE is less of a surprise by the time it comes out. About half of this morning’s weakness was in place before PPI due to the overnight oil price spike. Bonds are showing their first indication that they might try to find their footing with 10yr yields around 4.92, but we’re not counting chickens yet.


The rental market has shifted from shiny, surface-level perks to grounded, functional living. This guide will unpack the priorities shaping where people choose to settle down in 2026.
The post What Renters Are Looking for in 2026 appeared first on Redfin | Real Estate Tips for Home Buying, Selling & More.