









Hands stacking coins to illustrate saving, budgeting, or building financial growth

Mortgage Rate Intelligence & Market Updates

Stay informed about economic developments that may influence mortgage rates and home financing decisions. Explore updates covering inflation, Federal Reserve policy, Treasury yields, housing trends, and other important market indicators. Use the category filters to browse relevant economic and mortgage news, then select an article to read the full update. Review the latest stories and market insights to better understand changing conditions when considering your mortgage options.
RATE WATCH
FED FUNDS RATE 3.88%
NEXT FOMC 10/28/2026
NEXT MOVE 28.4% HIKE
IMPLIED CHANGE +7.1 bps
12-MONTH OUTLOOK +81.7 bps 3 or 4 hikes
TARGET BAND 3.75 - 4.00%
SOFR 3.87%
LATEST FED UPDATE 10/5/2026

What Today’s Economic Data Can Mean for Mortgage Rates

Mortgage rates can respond to changes in inflation, employment, Federal Reserve policy, Treasury yields, and expectations about future economic growth. These factors do not determine mortgage rates by themselves, but they can influence the broader bond market and the pricing lenders offer.

For homebuyers and homeowners, the important question is not simply whether economic news is “good” or “bad.” The key is how new information changes expectations for inflation, interest rates, and the economy. Those changes can contribute to mortgage rate movement and affect purchasing power, refinance opportunities, and monthly payment estimates.

Use the market updates below as supporting information, then consider your specific loan type, credit profile, property, and financing goals when evaluating current mortgage options.

Economic News Hub

Real Estate & Financial Market Updates

Article
Will Mounting Supply Chain Strains Hamstring the AI Investment Boom?

Will Mounting Supply Chain Strains Hamstring the AI Investment Boom?

Hunter L. Clark, Jeffrey B. Dawson, and Shad Turney Editor’s Note: The original version of the post included an inaccurate statement about the last chart. The chart itself is correct….
Stress and Strain from NBFIs to Banks

Stress and Strain from NBFIs to Banks

Viral V. Acharya, Nicola Cetorelli, and Bruce Tuckman Do the recent stresses in the NBFI space—notably the bankruptcies of Tricolor and First Brands, and the decision of Blue Owl Capital…
Same Shock, Different Roads? A K‑Shaped Pattern at the Pump

Same Shock, Different Roads? A K‑Shaped Pattern at the Pump

Rajashri Chakrabarti, Thu Pham, Beck Pierce, and Maxim Pinkovskiy In March 2026, energy prices surged to a four-year high, driven by the Iranian closure of the Strait of Hormuz amid…
In What Ways Has U.S. Trade with China Changed?

In What Ways Has U.S. Trade with China Changed?

Hunter L. Clark and Gregory Simitian Over the past year, U.S. trade policy with China has undergone enormous changes, but with surprisingly little effect on overall trade balances. In fact,…
Explaining the K‑Shaped Economy: What’s Behind the Divide?

Explaining the K‑Shaped Economy: What’s Behind the Divide?

Rajashri Chakrabarti, Thu Pham, Beck Pierce, and Maxim L. Pinkovskiy In our companion post, we used a new module of our Economic Heterogeneity Indicators (EHIs) to shed light on how…
Tracking the K‑Shaped Economy: Who’s Driving Spending?

Tracking the K‑Shaped Economy: Who’s Driving Spending?

Rajashri Chakrabarti, Thu Pham, Beck Pierce, and Maxim L. Pinkovskiy Editors’ Note: The title of the second chart in this post has been corrected. May 1, 10:40 am.   Aggregate…
Bank Failures: The Roles of Solvency and Liquidity

Bank Failures: The Roles of Solvency and Liquidity

Sergio Correia, Stephan Luck, and Emil Verner Do banks fail because of runs or because they become insolvent? Answering this question is central to understanding financial crises and designing effective…
The R*–Labor Share Nexus

The R*–Labor Share Nexus

Sophia Cho and John C. Williams Over the past quarter century, the U.S. economy has experienced significant declines in both the labor share of income and the natural rate of…
Rodney Rose Mortgage Team
Loans available nationwide
Low Rate, Low Fee.
"A Loan for every home"
Guaranteed Closing*
Rodney Rose, Loan Officer and Branch Manager
Rodney Rose
Loan Officer / Branch Manager
NMLS#: 1396861 DRE#: 00853403
C: (916) 232 3040
E: rrose@emortgagecapital.com
W: MortgageMarketUpdate.com
Better Business Bureau accreditation badge on a white background
Offices
Assessing the Current State of Wage Inflation

Assessing the Current State of Wage Inflation

Economists often look at nominal wage growth to gauge labor market imbalances, price pressures, and households’ spending ability. But to use wage growth for these purposes, it is important to look through short-run fluctuations and retrieve underlying wage inflation. In this post, we use our own measure of wage growth persistence—called Trend Wage Inflation (TWIn in short)—to summarize what we learned from wage growth behavior in the past years and draw conclusions for what may lie ahead. Since peaking in late 2021, TWIn has been on a steady decline, reaching levels near those of the 2017-19 period. In the past few months, however, this decline seems to have lost momentum. Our analysis shows that most of the decline in TWIn between 2022 and 2025 was common across industries. Recently, however, a few sectors have shown a decoupling of wage growth dynamics.


Read More »
AI’s Macroeconomic Challenges and Promises

AI’s Macroeconomic Challenges and Promises

In the third quarter of 2025, America’s largest tech firms for the first time spent more on capital investment than they earned from operations. The implication is that AI, a technology with the potential to make the economy more productive, is, for now, absorbing resources faster than it is generating returns. This post discusses how the tension between AI’s long-run promise and its short-run costs affects the outlooks for inflation, real activity, and financial stability.

Read More »
The Global Credit Cycle in Corporate Bond Returns

The Global Credit Cycle in Corporate Bond Returns

The global corporate nonfinancial bond market is both a large investment asset class and a vital source of funding for nonfinancial firms. With $19 trillion outstanding at the end of 2024, a broad portfolio of corporate bonds would be expected to be well diversified. Yet, in 37 percent of months between 1998 and 2024, more than 80 percent of bonds in the ICE Global Bond Indices—a portfolio with over 10,000 constituents spanning diverse industries, credit ratings, and regions—moved in the same direction, suggesting a large degree of synchronization. In this post, we introduce the global credit factor, which proxies for the global price of risk in international corporate bond markets. The global credit factor creates a global credit cycle in bond risk premia and generates predictable comovement in bond prices.

Read More »
Honey, Who Shrunk the U.S. Income Surplus?

Honey, Who Shrunk the U.S. Income Surplus?

Foreign holdings of U.S. financial assets are immense, with official estimates putting their current market value at $69 trillion. U.S. holdings of foreign assets are also impressive but much smaller, at $41 trillion. The shortfall in U.S. foreign assets relative to foreign liabilities has been mounting for decades. Yet U.S. investment income receipts—in profits, dividends, and interest—comfortably exceeded income payments until recently. We show that the fading of the net investment income surplus stems from the upward shift in interest rates in the aftermath of the pandemic along with the continued net sales of U.S. assets to foreign investors.

Read More »
Do Job Postings Show Early Labor‑Market Effects of AI?

Do Job Postings Show Early Labor‑Market Effects of AI?

As generative AI tools become more widely used, a key issue is the technology’s impact on labor demand. Where might we find evidence of that impact? In this post, we examine whether early evidence of AI’s effect on the labor market appears in firms’ job postings. We combine an occupational measure of AI exposure with detailed U.S. job-posting data from Lightcast, which aggregates listings from company career pages, national and local job boards, and job-listing aggregators. Using this data, we test whether postings for AI-exposed occupations declined disproportionately since the release of ChatGPT in late 2022. We find that, while overall hiring has slowed since then, the evidence from job postings provides little indication of a distinct AI-driven decline in labor demand.

Read More »
Federal Student Loan Defaults Return After Pandemic Pause

Federal Student Loan Defaults Return After Pandemic Pause

During 2026:Q1, household debt balances increased slightly, by $18 billion, to reach $18.8 trillion, according to the latest Quarterly Report on Household Debt and Credit from the New York Fed’s Center for Microeconomic Data. Amid upticks in mortgage, HELOC, and auto balances and a seasonal decline in credit card balances, student loan balances remained unchanged. However, the share of student loan balances past due increased, nearing pre-pandemic levels at just over 10 percent. In this post, we focus on which borrowers entered default on their federal student loans over the past two quarters. We find that the average borrower entering default is nearly 40 years old, was not past due on their student loans prior to the pandemic, and is more likely to live in the South. While defaulted borrowers are more likely to be past due on other forms of debt, the overall scope of student loan defaults is still relatively low, suggesting that fears of broader contagion to other credit products are premature.

Read More »
Will Mounting Supply Chain Strains Hamstring the AI Investment Boom?

Will Mounting Supply Chain Strains Hamstring the AI Investment Boom?

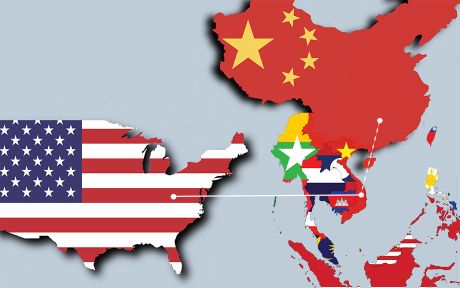
The conflict in the Middle East has precipitated a global supply shock—the third in six years following the pandemic in 2020 and Russia’s invasion of Ukraine in 2022. The current shock raises the specter of spillovers to the U.S. through both prices and physical shortages of goods. A critical conduit for spillovers through these channels is via Asian supply chains, especially from middle- to lower-middle income countries in southeast Asia, which are key suppliers for goods needed for the AI infrastructure build-out in the U.S. These countries are also heavily reliant on Middle East energy imports. This post examines key factors related to these Asian supply chain vulnerabilities.

Read More »
Stress and Strain from NBFIs to Banks

Stress and Strain from NBFIs to Banks

Do the recent stresses in the NBFI space—notably the bankruptcies of Tricolor and First Brands, and the decision of Blue Owl Capital Corp II (OBDC II) to end its redemption program and return capital through a wind-down of the fund—create distress for banks? The general sentiment is that the recent stresses are unlikely to amount to systemic concerns, although it does not mean there might not be “some stress and strain” for banks and that policymakers are “watching carefully” for exposure across banks. In a series of previous posts, we showed that shocks to nonbank financial institutions (NBFIs) directly impact banks that have exposures to NBFIs. In this post, we show that bank stocks have been directly impacted by NBFIs yet again. In short, NBFI troubles do result in “stress and strain” for banks.

Read More »
Same Shock, Different Roads? A K‑Shaped Pattern at the Pump

Same Shock, Different Roads? A K‑Shaped Pattern at the Pump

In March 2026, energy prices surged to a four-year high, driven by the Iranian closure of the Strait of Hormuz amid the ongoing conflict in the Middle East. In this Liberty Street Economics post, we use the new consumer spending module of the Economic Heterogeneity Indicators to analyze recent changes in nominal and real gas consumption across different income groups. We find that households had very different experiences with gasoline spending: in March, high-income households increased nominal spending the most and kept real consumption essentially unchanged, while low-income households decreased real consumption of gasoline but still saw sharply increased nominal spending because of the rise in gas prices. Therefore, with the sharp increases in gasoline prices in March, a K-shaped pattern in gasoline consumption emerged—showing faster consumption growth for high-income households relative to low-income households. These gasoline consumption patterns qualitatively match those following the increase in energy prices at the beginning of the Russia-Ukraine war in spring 2022, even though the gap in consumption trends during the current episode is quantitatively larger.

Read More »
By using our site, you agree to use our cookies. For more information, read our Privacy Policy